Traffic Data Accuracy Tool
Download the TDAT onepager here:
Please contact us if you would like to know more:
Follow the link below to request a quote for TDAT:
Traffic Data Accuracy Tool™ (TDAT™) by Hermes Traffic Intelligence uses proven and transparent methods to analyze, validate and certify critical data purchased from services such as Garmin, TomTom, HERE, and Google/Waze.
Traffic data and you
Competing providers of traffic related data claim to have the “best” data. You, the customer, have the difficult task of:
- Determining decisive factors when choosing a data provider
- Verifying that the data provided in fact are applicable for the intended use case
- Validating that data are accurate
Using our proprietary tools, Hermes TDAT™ delivers extensive and detailed insights as to the value and applicability of any source of traffic data.
We understand data
We have extensive expertise and tools for data driven traffic decision support. At Hermes Traffic Intelligence we analyze, decipher and evaluate any data source.
Client problem:
- Need to compare multiple data streams
- Require visualization of critical points
- Desire outside expert opinion on the various available data sources
Hermes TDAT™ solution:
- Customize reports for each individual agency and department responsibility
- Visual examples showing essential characteristics/discrepencies of data
- Expert opinion on applicability of the data streams to the decision making process
At a fraction of the data stream cost client receives experienced council and a clear view of how acquired data are best applied to the decision making process (i.e. in this case, budget allocation).
Tools in the toolbox
The tool is really a toolbox which includes a number of specialized tools developed by Hermes Traffic Intelligence:
- Netmatching for providing high precision linear couplings
- Geometry Toolbox for perform geometrical processing
- Data Stream Comparer to compare time perspectives of dynamic data streams
- Preprocessor is used for preparing incident data for use in the Incident Visualizer
- Incident Visualizer for generating temporal/spatial overviews on incident impact.
Results
The results from comparing different datasources can be represented in a number of ways. One way is to visualize the incident response from each cource, i.e. to create response charts (as shown) below, coloring cells according to the measured speed surrounding an identified incident area, spanning both road segments and time.
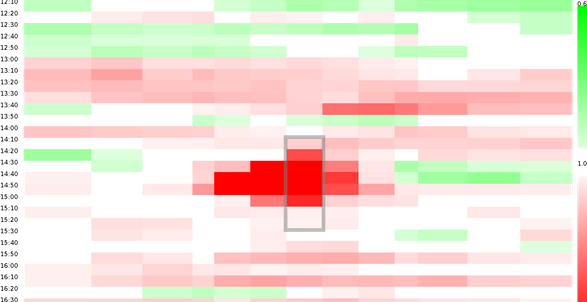
Incident response chart
Each row shows the speed measurements collected within a time interval, and each column represents a road segment before, under, or after the incident. Red cells have a speed lower than the speed normally measured in this cell, and green cells have a higher speed. The centered box marks the identified extent of the incident, both in tima and space.